Prof. Dr. Sohei Matsuno
ABSTRACT
On 11 Mar. 2011, at 14 hr. 46 min 30 sec (JST) at hypocenter, an unprecedentedly great quake, The 2011 off Pacific Coast of Tohoku Earthquake, took place. It was followed by an unprecedentedly high tsunami 40 minutes later. It’s also unprecedented that identification of the quake and tsunami differs institute-by-institute, time-to-time, even in a single statement or report. Magnitude, for example, ranges 7.9~9.4, likewise, epicenter: 60~130 km offshore, focal depth: 10~40 km, and tsunami height: 3~40 m. Some deviations are usual in these indexes. But they deviate from an imaginable scope. This paper tried to define the indexes by means of usual devices based on the plate tectonic theory, and it itself has realized difficulties in determining a set of compatible indexes, especially in magnitude. This paper judges that the Quake had unprecedented quality, from which all excessive quantities emerge. The matter is that the quantities over-scaled the capacity of the current seismic-technical system. There must be essential revisions on the system, in which the theory of plate tectonics is one of the objects.
Keywords: the cause of unprecedented quake and tsunami, revision of plate tectonics _____________________________________________________________________________________________________________________
Civil Eng. Dep., Faculty of Eng., IBA Univ. Palembang, Indonesia
INTRODUCTION
Qualitative peculiarity of The 2011 off Pacific Coast of Tohoku Earthquake (the Quake)
The Quake was unprecedentedly great. It’s a quantitative peculiarity that’s measurable by and visible on apparatuses such as seismographs, tide gauges and survey devices. Generally speaking, if there’d be any unprecedentedly great quantity in a phenomenon, there’d be unprecedented quality that causes the quantitative extravagancy. The writer suspects the Quake had a qualitatively different mechanism of rupture from past quakes that’ve been simply defined as shear failures in the theory of plate tectonics (the Theory). The Quake can’t be explained by shear whose failure is spatially limited in a shear surface by nature. The Quake’s failure wasn’t limited in a shear surface. If the rupture is, e.g., buckling, its failure won’t be such local (sectional) but general (structural). The writer tries to establish a hypothesis based on the two qualitative characteristics of the Quake, viz. (i) the Quake of M 9 was preceded by foreshock (Q0) of M 7 two days before, and (ii) the Quake comprised three main-shocks, Q1, Q2 (greatest) and Q3, which were observed by seismographs at several tens of seconds intervals. These can’t be explained merely by failures on a shear surface. In this context, the Theory must be revised.
Purposes of this paper
First, this paper shall confirm variations and fluctuations in announcements, comments etc by the institutions concerned on the identities of the Quake. Second the paper itself shall identify the Quake and single out peculiarities of the Quake, which make the identification be difficult. Third, it shall clarify the causal link between problematic identification of the Quake and the Theory, exhibiting obvious discrepancies between the real status of the Quake and the Quake identified by the Theory. Last, it shall forward a hypothesis that explains the Quake without contradictions.
Wandering Quake identification
(1) General
It commenced when JMA first announced ML 7.9, epicenter: 67 km offshore Ojika Peninsula, focal depth: 10 km. Since then, statements, reports etc by the various institutions concerned have been roaming about inter/intra institute, time-to-time and even in a single statement or report. The situation is residing as of date (Aug. 2011). There’ve been a lot of explanations, apologies, justifications, predictions, e.g., attributing changes to newly found facts, miss-prints in illustrations, interruption of data transmission from seafront sensors by quakes and tsunamis, saturation in seismographs, saying this fiasco will be settled when Quake’s long waves (less susceptible to saturation) will be analyzed, justifying the diverse as a usual feature until it’ll converge to a truth through discussions and selections, though recognizing it’ll take time.
The writer is of the opinion that it’ll reach a set of the Quake identities being compatible each other if dictated as JMA is doing (unavoidable) or the Theory revised as recommended in this paper (desirable). Now, let’s learn the matters in detail.
(2) Date of the Quake
It’s 11 Mar. 2011, at 14 hr. 46 min. – sec. (as of Aug. 2011)
The date of the occurrence of the Quake at a hypocenter fluctuates as its location fluctuates, since quake’s traveling time from the hypocenter to any seismograph must be subtracted from the time recorded by the seismograph. But the difference is in the sec order, as the variation of hypocenter locations among statements is within 70 (km). The statement on the date without sec reflects the still-uncertain location of the hypocenter as of the date.
(3) Hypocenter (epicenter and focal depth)
Epicenter
An epicenter is a projection of a hypocenter in an X-Y-Z coordinate on the X-Y coordinate. The epicenter in the X-Y coordinate normally falls in a relatively narrow scope of deviation. Even in this relatively easy subject, USGS and JMA showed different offshore distances of 80 and 120 (km). An epicenter is usually not such a rough entity, though it isn’t so precise to be pin-pointed as ‘142.861°E, 38.104°N, 23.7-km depth (IN).’
Focal Depth
The identification of focal depth is more controversial than of the epicenter. In this regard, the writer introduces an episode. It was 1959 when he was engaged in a seismic prospection to have a geological profile at a cross-strait bridge site. An explosive device was set 12-m deep under GL at one of the shores. Six seismographs were set two, on land and four on seabed along a 500-m long horizontal alignment at an equal 100-m interval from the explosion point across the strait. Analyses (strictly abided by the rule set up) gave a depth of the explosion at 60 m. It implies that the results depend on how to read the data from seismograph records. So is it now.
In the case of the Quake, there’re 37 observation stations lined-up in a formation of trans-northeastern Japan (see Fig. 1). It isn’t in favor of determining focal depth but the location of a quake. It’s understood in analogy with a survey of the height and the location of a tower. In this context, a formation of seismic stations of Tohoku Univ. (E-W formation, not shown in this paper) better fits the purpose. But the hypocenters in published literatures from the institution have yet to be consistent, since the data stream was disrupted during the Quake.
Cause of variation in procedure
There’s basically nothing new in the method to identify Quake’s hypocenter. That is, (i) choose the best combination of three observation points (including the nearest station from the epicenter) from applicable observation points, (ii) calculate the distance between each observation point and the hypocenter based on the duration of P-waves and an applicable hodograph, (iii) define hypocenter in an orthogonal 3-D coordinate by means of CAD.
In these processes, there’re some factors that result in variation, e.g., a beginning point of S-waves is often unclear. It results in a deviation of the focal depth. How to read the unclear S-waves’ starting point is done by computer. Hence, if there’d be any unprecedented phenomenon that wasn’t taken into account at the time of computer programming, it gives wrong outputs. If it’d be the case, like the Quake, the processing must be done manually. Because of the unprecedented pattern of the Quake, the variation, i.e., the scope of choice is great in the manual procedure. This is the background, against which various hypocenters have been appearing for the Quake.

Fig. 1 Seismograph formation and records of the Quake (origin IN)
(4) Magnitude
General
Magnitude is the greatest sufferer of the unprecedented peculiarity of the Quake. There’re currently two major scales to measure magnitude, viz. Richter and Moment. The Richter scale magnitude (ML) is simple, hence, popular among the people. The Moment scale magnitude (MW) logically better convinces, hence, loved by seismologists. However, even if MW is announced, mass media report it without a kind of scale. Making the situation more confused, ML is conveniently used by institutions for quick information.
But it’s a superficial matter in the wandering announcement. There’s an essential cause that has made the weakness of the Theory (the base of the current seismology) come up to the surface. Quake’s unprecedented pattern played a role in it. That is, usual quake’s waveform is such that the amplitude steps up when P-, S-, L-wave arrives at a seismograph; the stylus excursion reaches a peak, and fades out with undulation. To meet a social need for quick information, computer programs have been provided for the usual seismic pattern. The fluctuations commenced when the two seismology heavy-weight, JMA and USGS, announced in their firsthand information ML 7.9 based on the usual routine procedures*1. The Quake wasn’t of that usual, i.e., an unprecedented 2nd main-shock (Q2), ignored by computers as an aftershock, which showed even greater excursions than the 1st one (Q1), followed Q1 (see Fig. 2)*2.
Time (sec)

(a) K-net Ishlnomaki (MYGO10) N-S Component
Time (sec)

(b) KiK-net Rikuzen Takada (IWAH27) N-S Component
Fig. 2 Acceleration (above) and displacement (below) of Ground motion (origin IN)
Having had information of real disasters, the seismograph records were reviewed and Q2 was found. To meet the reality, the previous information was updated to ML 8.4. It’s been followed by consecutive fluctuations from MW 8.8 up to 9.4*3. They are the results of Centroid Moment Tensor (CMT) analyses with Global Positioning System (GPS)*4, which have induced a variety of data for MW analyses, i.e., epicenters, focal depth, strike-, dip- / rake- angles, fault areas, fault offsets, quake energy, etc.
*1 MW was premature at that time of quick information, as it needed data from CMT.
*2 The manual identification of Magnitude by the Theory users was one-by-one different.
*3 JMA explains fluctuations saying, ‘The promptly-estimated M7.9 was based on Mjm. It can be calculated within several minutes. But it has a downside to be saturated for magnitude substantially larger than 8. JMA updated Mjma to 8.4 at 16:00 and determined moment magnitude (Mw) as 8.8 by CMT analysis at 17:30, which were calculated from overseas broadband seismic data. On March 13, Mw was revised to be 9.0 by CMT analysis using a longer range of filter. They weren’t used for the tsunami warnings, because sea level observation had given us substantially large tsunami height before these larger magnitude values were obtained. To obtain Mw earlier should be one of the most important tasks for us to be solved.’ Tomoaki Ozaki (2011).
*4 CMT analyses to define MW were a cause of the sequent fluctuations, as the process is subjective. Results are so adjusted as to meet respective studies’ convenience. The Quake was so unprecedented that endorses any of them generously.
(5) Tsunami wave height
It’s usual for one quake to generate one principal tsunami wave. It travels to a coast. Immediately after the Quake, authorities, as usual, announced prospective tsunami height and its arrival times at the respective regions as Table 1.
Table 1 Forecast Tsunami Arrival Time and Height (non-related regions omitted)

10 min after the Quake, the Sanriku Coast had tsunami waves of moderate height as Table 2.
These are of Ts1 generated by Q1. Then, 40 min after Q1, unprecedentedly, the 2nd wave of much higher than the 1st one devastated the northeastern coast of Japan. This is Ts2 caused by Q2.
To cope with the unprecedented reality, the data were updated, in spite of a late start, to 10 ~ 36 (m) without clearly differentiating Ts1 and Ts2, as there’s neither identity nor record of Ts2, though significant evidence is at the sites (see Fig. 3).
JMA explains no-record status of Ts2 as follows:
‘In this huge tsunami, many sea level station data streams were disrupted by various causes, such as flooding or washout, electric power failure, and/or wiring disconnection. As a result, tsunami warnings were based mainly on data from sea level stations that survived. For some stations, tsunami records were retrieved by JMA's post-tsunami field surveys. (While) these media preserved a bit longer data record after the online transmission ceased, even these time series were disrupted, implying that there must have been even larger tsunami heights at these stations.’ Tomoaki Ozaki (2011).
Table 2 Tsunami height record by PARI and JMA (unit: m)

Note: PARI: Port / Airport Research Institute, JMA: Japan Meteorological Agency

(a) Between Miyako and Noda (b) Between Ishinomaki and Yamada
Fig. 3 Ria coast Sanriku and the range of tsunami height (origin IN)
The variation in tsunami height even at near locations has a reason. A tsunami wave height when initially generated at an epicenter differs greatly after it reached a coast, being affected by the contours of the coastline. At places of monotonous coastline, the wave height won’t change; but on the coasts where there’re many irregularities, waves at the bay mouths reach abnormal height when they enter the bays.
As seen in Fig. 1 and 3, the Sanriku Coast is of a Ria type that has various sizes of embayment. It causes a seiche vibration, i.e., forced vibration of bay water by an exciting force, i.e., tsunami. Solutions for simplified mathematical models are shown in Fig. 4. Bay water has each natural seiche period. When tsunami waves’ period nears it, resonance takes place, causing high waves. The amplification is pronounced for a tsunami of short wavelength (period) in a short bay, while with a tsunami of long period, it’s more marked in a long bay (see Fig 5). The real response spectrum of Sanriku bays is shown in Fig. 6.

(a) Resonance curve of slender bays (b) ditto fat bays with a breakwater
Fig. 4 Resonance curves of simplified rectangular bay models
Amplify ratio

▲ Seiche period (min)
Fig. 5 Amplify ratio vs. seiche period
Origin: JACE (1969)

Fig. 6 2011, 1896, 1933 tsunami height (IN)
THE QUAKE IDENTIFIED BY THE WRITER
General
One of the unprecedented features of the Quake is that it comprises three main-shocks, Q1, Q2 & Q3. This paper identifies the Quake, focusing on Q1 & Q2, and 1st & 2nd tsunamis (Ts1 & Te2, created by Q1 & Q2 respectively).
Date of the Quake (at hypocenter)
Q1: at 14 hr. 46 min 30 sec, Q2: at the same time as Q1
(Explanation)
Q1 & Q2 occurred simultaneously. Q1, reached seismographs first as it’s nearer to them than Q2. Q1’s time of arrival at a seismograph of the nearest observation station is read on records. The date when Q1 occurred at its hypocenter is defined subtracting its travel time from its hypocenter to the seismograph from the arrival date.
Likewise, Q2’s arrival date can be defined if its P-wave’s beginning point is found in a stylus excursion record. As it is in Q1’s waveform, there must be some physical-mathematical processing to filter all noises and to extract targeted waves. But it was realized that it could achieve the object only with great subjective / creative inspiration that the writer doesn’t possess. The time lag between Q1 & Q2 is known by the S-waves of the two. The matter is if this time lag is due to the difference of occurrence time or distance between the two. It was found by a basic method (later explained) that the time lag was caused by the distance between the two epicenters of Q1 & Q2. As per the writer’s hypothesis, Q2 occurred simultaneously with Q1. If the hypothesis can better explain the phenomena than the Theory does, then the former is better than the latter.
Hypocenter (epicenter and focal depth)
Epicenter of Q1: 130 km off the Kinkazan Cape of the Ojika Peninsula. Focal depth: 20 km
Epicenter of Q2: 300 km off the Kinkazan Cape. Focal depth: unsure, maybe 15~20 km deep
(Explanation)
This paper computed the distance (si) between Q1’s hypocenter and a seismograph at the nearest to the hypocenter by a popular Formula si = T / (1/Vs – 1/Vp) …… {1}, where
Vs: propagation speed of S-waves= .4 (km/sec), Vp: ditto P-waves = 1.73×Vs = 5.9 (km/sec),
T: duration of P-waves (read on seismograph records) = 22.5 (sec)
Substituting T, Vs and Vp into Formula {1},
si = T×(1/Vs – 1/Vp)-1 = 22.5×(1/3.4 - 1/5.9)-1 = 22.5 (sec) × 8.0 (km/sec) = 180 (km),
When si has been determined for three observation stations, the hypocenter can be defined by 3D-AutoCAD in an orthogonal coordinate X-Y-Z (original point at the observation point and the X-Y coordinate on Mean Sea Water Level (MSWL)) at a point where the three spheres (radii: s1, s2 and s3, center: each observation point) meet. In practice, they don’t meet at one point but makes a spherical triangle, in which the hypocenter is. The epicenter is in a triangle that’s the projection of the spherical triangle on the X-Y coordinate. The epicenter is most probably at its centroid. It’s at 130 (km) off the Kinkazan Cape. A hypocenter is vertically beneath the epicenter on the spherical triangle, and a focal depth is the length of the segment. The vertical scope of the spherical triangle is normally great. If the focal depth given in this way contradicts the reality, it may be moved within the scope. Really, of Q1, it ranges 10 ~ 40 (km). Within the range, 20 (km) was chosen, since the depth of continental crust at the epicenter is about 20 (km). This is the point where Q1 started its fracturing first.
Q2’s epicenter can’t be identified in the same way as its P-waves hide behind Q1’s wave form.
There’re two ways to estimate Q2’s epicenter.
One is based on Ts2’s wave propagation velocity (but its result is for reference only) and the other is on the time lag between Q1’s & Q2’s S-waves (it is to determine).
The former uses popular Formula {2} with bathymetric data along tsunami’s traveling route and traveling time, 40 min: v = √ (2*g*h) ……. {2}, where
v: tsunami’s propagation velocity, g: gravitational acceleration, h: seawater depth at the point.
By numerical integral calculations, Q2’s epicenter is identified approximately 300 (km) off the Kinkazan Cape. It’d be on the protracted Kinkazan–Q1 epicenter line as per Fig. 1.
The latter is from S-waves’ time lag between Q1 & Q2, T = S2/Vs – s1/Vs …….… {3}, where
T: Arrival time lag between Q1’s and Q2’s S-waves, from Fig. 2 (a), = 50 (sec),
Vs: Propagation velocity of S-waves = 3.4 (km/sec),
s1: Q1’s epicenter distance from the seismograph, already defined, = 180 (km),
S2; Q2’s epicenter distance from the seismograph,
Substituting values of s1, T and Vs into {3}, S2 = s1 + T × Vs =180 + 50 × 3.4 = 350 (km).
Subtracting seismograph-Kinkazan distance, 50 (km),
Q2’s epicenter: 300 (km) off the Kinkazan Cape on the protracted line of Kinkazan - Q1.
Magnitude
Richter scale magnitude (ML): 8.5. Work-Done magnitude (MWD): 9.4
(Explanation)
The writer computed the Richter scale magnitude of Q1 by a popular Formula {4}.
ML = log10A + distance correction term – constant = log10A + 3*log10(8*T) – 2.92 .....{4}, where A: maximum excursion of the Wood-Anderson seismograph (mm), T: duration of P waves (sec). Substituting A = 1000, T = 35 into {4}, ML = 7.5. It’s too small.
Regarding Q1, Q2 & Q3 as one quake, i.e., adding energy of the three, ML is computed with the same popular formulae. It gives ML = 8.5. It’s still too small.
There’re two causes of the too-small solutions. One is the so-called saturation effect. It can be adjusted by changing the constant in {4}. The other one has no easy solution. It’s the unprecedented character of the Quake. The Quake has brought these technical and theoretical weaknesses of the current system of seismology to light. Currently, quakes are analyzed exclusively relying on the excursion of seismograph’s stylus and the Theory’s simplified quake mechanism. The Quake has proven they no longer work. The writer has solved the Quake by (i) computing Work-Done (WD) of a quake and (ii) converting it to the work-done magnitude, MWD that’s further convertible into ML, but still relying on the Theory.
The moment magnitude (MW) aims at the same, as it has been obvious that ML doesn’t suit to analyze big scale quakes. However, MW still depends on Theory’s fantastic assumptions, i.e., ‘A quake occurs by inter-strata shear on one fault plane.’ That is in detail;
MW stands on the seismic moment (M0), which is a quantity that combines a area of rupture, or fault (S), and the amount of fault offset (<d>) with the shear modulus (of rock as Formula M0 = × S × <d> ………………… {5}
The moment magnitude Mw is defined by Formula MW = 2/3*log10M0 – 10.7 (erg) …..… {6}
The constant in the equation is chosen to achieve consistency with the magnitude produced by the Richter scale. The fact that makes MW be inconsistent with the reality is that the Function, M0 ( S, <d>), on which MW stands is a derivative from Theory’s assumptions.
The work-done magnitude (MWD) stands on WD by a quake.
It’s defined by a quantity that combines the following factors:
elevated height of ground (<h>), the areas of elevated ground (S), depth (<d>) and unit weight of rock in water (r), all from data, i.e.,
WD = S × <h> × r × <d> (unit erg or dyne-cm) ………... {7}
Of the Quake, S = 7000 (km2), <h>=24 (km), r=2 (gw/cm3), <d>=2.3 (m). Put data into {7}, WD=7.573*1025 (erg). This is the total energy radiated by the Quake.
From log10E = 11.8 + 1.5*MWD, ……….. {8}, where E: energy of a quake (erg).
MWD = (log10(WD) - 11.8) / 1.5 = (log107.573*1025 – 11.8) / 1.5 = 9.386 => 9.4
Isn’t it too great? The writer couldn’t reach a reasonable magnitude with the established devices.
Tsunami wave height
Ts1: 5-m high at a point 47-km off the Sanriku Coast.
After the arrival at the Sanriku Coast, it varied in a range of 3 ~ 9 m high.
Ts2: 12-m high when it arrived at the Sanriku Coast.
After the arrival at the Sanriku Coast, it varied in a range of 7 ~ 36 m high
(Explanation)
The writer identifies tsunami waves’ height as follows:
The wave of Ts1 was measured at 5-m high by two ocean-bottom pressure gauges installed off the Sanriku Coast (Fig. 7). It was amplified or damped to 3~9 (m) high when they entered the bays due to the seiche effect (later elaborated). It agrees to the reality (Table 2). There’s no record, no identity of Ts2, because the entire measuring instrument in land and waters were destroyed by the Quake. It was estimated based on mass-media’s tsunami information at a monotonous coastline, Fukushima NPP site (it’ll be explained in a different paper). It’s 12-m high when it reached the Sanriku coast. It was amplified or damped to 7 ~ 36 (m) high after entering the bays. Amplifying (damping) ratio of 2 ~ 3 (0.3 ~ 0.7) are from 1933 Sanriku and 1960 Chile tsunamis’ records (Fig. 5). The estimation well meets the reality (Fig. 3 and 6).

(a) Location of the ocean bottom pressure gauge
Wave height (m) TM1 (Oceanic side) TM2 (Continental side)
Time (hr: min)
(b) Sea Level Fluctuation
TM1: water depth: 1600 m, 77-km offshore, TM2: water depth: 1000 m, 47-km offshore
Fig. 7 SWL rise by Submarine Ocean-Bottom Pressure Gauge (origin Tokyo Univ. ERI)
PREPARATORY DISCUSSIONS ON THE QUAKE
General
Before entering the main topics, in which the writer convinces of the rationale of his hypothesis (revised plate tectonics) by explaining the Quake with the hypothesis, let’s confirm the concepts of the Theory and the hypothesis first.
The Theory
Theory’s quake mechanism (quoted from IN) is as follows:
Tectonic quakes occur anywhere in the earth where there is sufficient stored elastic strain energy to trigger fracture propagation along a fault plane. The sides of a fault move past each other smoothly and non-seismically unless there are irregularities or undulations along the fault surface that increase the frictional resistance.
A fault is constrained from relative movement of the plates at both sides of the fault. This forms a fixed point. Once the fault has locked, continued relative motion between the plates increases stress, then, stores strain energy in the volume around the fault surface. This continues until the stress has risen sufficiently to break through the fixed point, suddenly allowing sliding over the fixed point of the fault releasing the stored energy.’ Refer to Fig. 8.
Hypothesis (revised plate tectonics)
(1) Origin of the idea
The idea to revise the Theory has its origin 36 years ago in 1975 when the writer had talks with Dr. Shunzo Okamoto, then Prof. Tokyo Univ. in earthquake engineering. It went on in a manner of questions (Q, the writer) and answers (A, Prof.):
Q, ‘In your recent work, Shunzo Okamoto (1973), there’re two contradictory explanations about the epicenter of 1933 Sanriku quake-tsunami. It’s clearly defined digitally in a sentence as 300 km offshore the coast, while in an illustration; the location is shown analogically with much shorter offshore distance of about 150 km. Which is correct?’
A, ‘300 km is correct. The illustration is made by given data for readers’ reference.
Q, ‘What’s the ground to say so?’
A, ‘Water depth at the100s-km offshore is too shallow to generate such a big tsunami, but near enough to cause damage by the quake itself. 1933 quake caused no damage, but a tsunami 40~60 min later brought about a big disaster. The same was true for 1896 Sanriku and 896 Jogan quakes and tsunamis. They must have had epicenters of the same distance as of the 1933. A strong sea quake is a necessary condition of a big tsunami. A strong-deep sea quake is an enough condition. The latest example is 1960 Chile quake whose epicenter was thousands of km off the Sanriku Coast. It wasn’t felt in Japan but caused great tsunami along the Sanriku Coast. What on earth is that the time lag of 40~60 min between the quake and the tsunami is incompatible with the 100s-km off-shore epicenter.’
Q, ‘I’m of the same opinion. I think the matter has its root in the Theory that sees quakes on a subducting zone. May I dive in to the subject to revise it?’
A, ‘No, we shouldn’t invade other’s study field without solid evidence. If you do it now, please do with no relation to me.’ Adding, ‘Next tsunami will come sooner or later. It gives us solid evidence. At that time, you may study on the subject with me.’
Since then, a time has gone, and the Quake has come. It seems to prove his hypothesis in a drastic way. Alas, Prof. S. Okamoto had passed away. The writer has yet to do, but too old. He shall leave the theme for next generations.
(2) Differences between the Theory and the hypothesis
The hypothesis agrees to the Theory in principle (earth’s interior dynamics), and uses common terms. The differences are in its application to quakes or, in other words, its concept of a rupture in the lithosphere, i.e., when, what, where, how and why the rupture occurs.
There’re five major differences: viz. (i) The Theory assumes a homogeneous friction between the over riding continental lithosphere and the uppermost part of the subducting oceanic plate, unless there happen to be irregularities on their inter-layer surface. The hypothesis assumes the continental lithosphere and the oceanic plate are rigidly deposited each other along the 50-km long leading edge of the continental lithosphere (contacting surface). Together with corrugation (folds) along the contacting surface, no inter- layer slipping (but stripping) happens there.

Fig. 8 Quake mechanism by the Theory (ii) The former assumes arbitral sticking happens
in an otherwise-smooth (hence, non-seismic-event) inter-layer surface. If sticking happens, the relative motion is constrained. Then, Strain energy is generated and stored in the nearby volume of the sticking point. A quake occurs releasing this energy over the sticking point. The latter assumes the sticking is at 50-km-long contacting surface only. The leading edge of the continental lithosphere plays a role of an anchor block. The strain energy is stored homogeneously in the continental lithosphere and oceanic plate behind and before the anchor block respectively. A quake happens at any weakest point in the continental lithosphere (in the crust rather than mantle as the former is more rigid and brittle than the latter). The crust at the leading edge of the continental lithosphere is strong due to forging by slow-cold works of compression, worked out by a tectonic thrust for hundreds of millions of years. Hence, this portion has never been and won’t be subjected to quakes, unless otherwise disturbed. (iii) The former attributes quakes only to shear failures along a fault, while the latter considers other types of failure as well, e.g., structural buckling, compression and/or tension rupture, given conditions. (iv) The former assumes the shear between the overriding and subducting plates is a sole driving power of ruptures in the crust. The latter assumes no stress other than compression in the continental lithosphere before rupture. That is, as per the hypothesis, the crust isn’t subjected to shear but compression. Further, the mantle is unable to transfer shear as it behaves as liquid under slow deformation. A rupture occurs by compression stress as a sole driving power at any weakest point in the crust, forming a rupture plane that’s independent of the inter-layer surface, though: the rupture plane may start (or end) up on the inter-layer surface. (v) The former assumes aftershocks propagate from an epicenter to both the continental and the oceanic sides along the fault plane. The latter assumes aftershocks happen seeking the 2nd, 3rd, ... weakest points in the crust of the continental side of the epicenter. The ocean-side crust from the epicenter in the continental lithosphere has been stress released, hence, there’ll be no failure anymore. A rupture of the continental mantle follows the crust layer rupture, taking over stress once shared by the crust layer before it ruptured. More importantly, it triggers another main-shock in the oceanic uppermost mantle beyond the boundary of the subducting zone. It develops aftershocks too, again in the continental side of its epicenter in the same plain. Refer to Fig. 8.
(3) Explanations of ordinary quakes by hypothesis
As per the hypothesis, ordinary quakes occur in the following mechanism*1. (i) The strong leading edge (anchor block) compresses the continental lithosphere towards the continent. (ii) The compression stress in the continental lithosphere increases generated by the viscous friction of the flowing upper mantle (aesthenosphere), storing strain energy in it. (iii) When the compression stress exceeds the strength of the continental crust (more rigid, brittle and less plastic, ductile, viscous than the mantle), anytime, at any weakest point, a compression rupture takes place along a rupture plane (fault plane). This is a main-shock. It occurs with the dip angle of 30°~40° (never 10° as the Theory users happen to assume).*2,3 (iv) Consecutive ruptures (aftershocks) occur with any types of rupture (compression, tension, bending or shear) seeking 2nd, 3rd, …. weakest points in the crust*4. They happen behind a main-shock epicenter within the scope of the volume weakened by the main-shock. (v) Every failure in the crust, increases compression stress in a continental mantle by transmitting its stress to the continental mantle that causes any kind of rupture in it. It induces quakes in the oceanic uppermost mantle beyond the Japan Trench with a similar mechanism to Q2 (explained in next Sect.).
*1 More than 95 % of earthquakes happen in the pattern from (i) to (iv) without (v).
*2 If an internal angle of friction of lithosphere rock (ϕ) is 30°, then Mohr’s circle gives dip angle (α) of 30°. If ϕ = 70° (Can it be?), then α= 10°.
*3 Seismology defines the fault plane by a focal mechanism (beach-ball). It defines strike, dip, rake angles, and place them at the hypocenter, all of which deeply owe to experienced expertise. The hypothesis regards it as disproportionate - irrelevant sophistication to the reality that ends up in 1 ~ 2-digit effective numbers.
*4 Any irregularity on the contact surface, or more generally, any point of discontinuity in the crust is eligible to be the weak point where a rupture commences due to stress concentration.
EXPLANATION OF THE QUAKE BY THE HYPOTHESIS
General
There was an unprecedented phenomenon (the cause of the Quake) from which all other unprecedented phenomena emerged. It was also the cause that made the Theory be unable to reasonably explain the phenomena. ML 7.2 (7.3 in Fig.9) foreshock happened two days before the MW 9.0 main event of the mid-no-quake zone is the one. The name of foreshock doesn’t represent its eminent role in the Quake. A 2-day time lag should be interpreted to a 0+ time lag in a geological timeline. Though the writer calls it foreshock in this paper, the name appropriately represents its essential role is, ‘an initial quake, Q0, in the Quake. The writer’s hypothesis explains the mechanism of it.
Foreshock ML 7.2
Depth (Source JMA) A foreshock ML 7.2 with a series of its
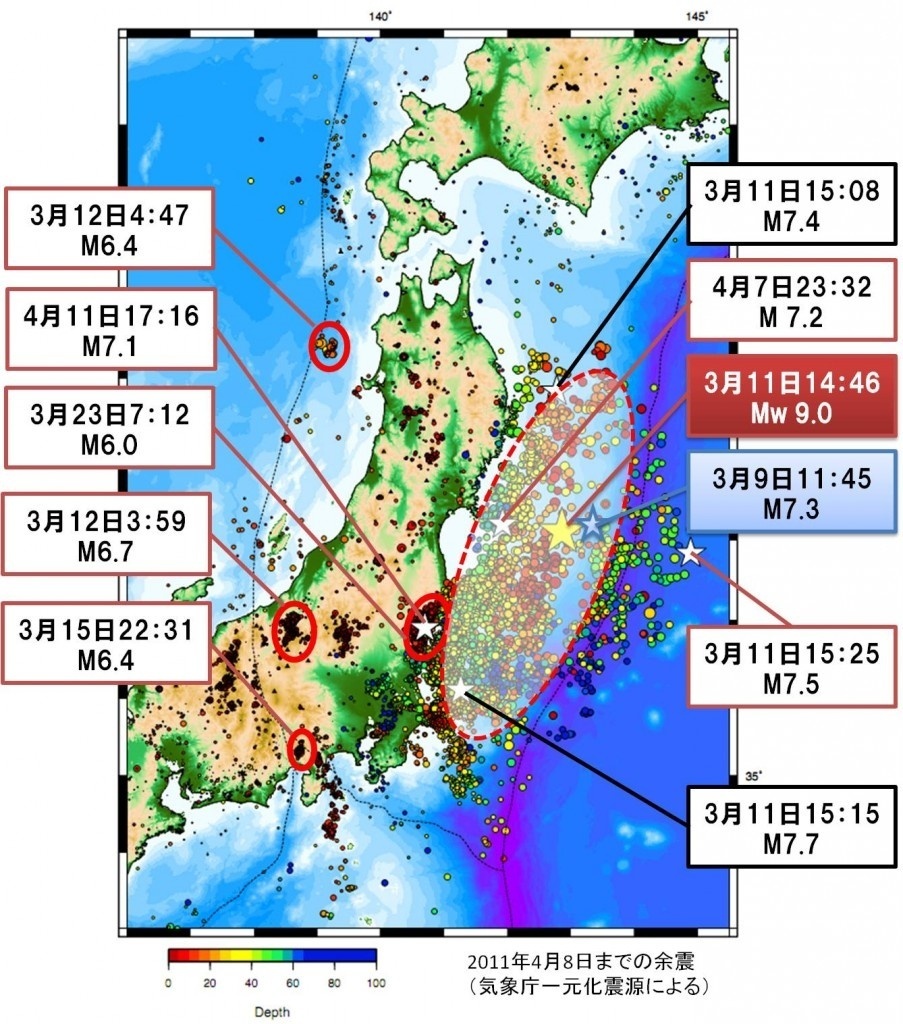
a no-event zone 170-km offshore the Sanriku Coast. Its hypocenter is 30 km distant to the Japan Trench (the boundary of the subducting zone) and 16 km deep. The 50-km long leading edge of the continental lithosphere has been subjected to slow-cold-work forging throughout hundreds of millions of years under plate tectonic interior loading, it’s too strong to be broken, i.e., it’s been a no-seismicity sanctuary. The foreshocks occurred in the mid sanctuary. Fig. 9 shows it. Why did the foreshocks happen there? Researchers at Tohoku Univ. admit the existence of this sanctuary calling it a ‘barrier.’ But they’ve yet to answer the question. The writer does it to complete his hypothesis at the end of this paper.
Destruction of the anchor block
The foreshocks destroyed the 20-km long continental crust of the 50-km long leading edge of the continental lithosphere, in which the crust is rigidly fixed with the continental mantle that is further fixed with the uppermost part of the oceanic upper mantle. This portion had played a role of an anchor block against the reaction from the continental lithosphere. The compression force is from the plate tectonic convection of the upper mantle (aesthenosphere). The function of the anchor block had lasted until it was destroyed by the foreshocks.
Scope of the anchor block destruction
The above destruction left the 30-km long portion of the total 50-km long leading edge intact (Note: the farther the distance from the leading edge is, the weaker the strength of the continental lithosphere is). The destruction was limited within the volume of crust, i.e., didn’t involve the continental mantle that’s less rigid but more ductile, plastic, viscose, i.e., less brittle than the crust. The geographic scope of the destruction in an X-Y coordinate is (30~40)*100 km2 whose westernmost edge just contacted the forthcoming Q1’s epicenter. In a Z-axis, it’s 16-km deep (= focal depth of the foreshock, ML 7.2). The dimensions in the X-Y coordinate are evidenced by any figures that show the epicenters of Quake’s foreshocks. The dimension in a Z-axis is from the IN data of Tohoku Univ. Japan.
Effects of the anchor-block destruction
It had three effects: (i) Unburdened the 30-km long intact leading edge of continental crust as the reaction from the continental crust had disappeared. The continental crust of the leading edge was drifting on the continental mantle after this event. (ii) Contrarily, it made the continental side crust of the foreshocks area be unstable, as it lost balance force from the anchor block. (iii) It burdened the continental mantle, as the crust that had shared more than 70 % of the total thrust from the aesthenosphere was handing it over to the continental mantle after its rupture.
Buckling of continental mantle
The stress redistribution, from the continental crust of the leading edge (a part of an anchor block) to the continental mantle (another part of the anchor block) commenced. While it was going, the continental mantle buckled as the section against buckling had been reduced. This point where the buckling started was Q1’s hypocenter. The length of the buckling line in Y-(N-S) axis was 100 km to the north from the epicenter. The buckling width in X (E-W) axis was 70 km. The seabed convexly deformed upward by 2 (m) first. Then, the continental mantle (10-km thick) buckled at the center of the convex deformation and projected from it almost vertically up to 5-m high. This fact is proven by Fig. 1 (b). It agrees to the buckling deformation. It doesn’t conform to an inverse fault by shear.
The buckling might have been prompted by melting of the lower part of the uppermost mantle due to the reduction of compression stress under the uppermost mantle, while its convex deformation preceded the buckling. The series of the phenomena happened in a moment. The buckling caused Q1 & Q2 as stated in the next Sub-sect.
Effects of buckling of continental mantle
The buckling created effects in X, Y and Z axes.
The one on the Z axis is the upsurge of Sea Water Level (SWL) at the buckling area. The SWL-elevation form coincides to the seabed elevation form due to buckling. It’s the origin of Ts1. The sea depth at the buckling area is 1700 (m) that could generate a modest tsunami. A researcher explains Ts1: ‘The ground motion of the Quake reached the pressure gauge at TM1 (ocean-side). It was immediately followed by the gradual rise of the sea level up to 2 m high. After 11 minutes, the sea level abruptly rose by 3m, having elevated the sea level 5 m high in total. At TM2 (located 30km towards the land from TM1), the same pattern of sea level elevation was recorded with 4-minutes delay from TM1.’ See Fig. 1.
The consequence of the buckling in an X (E-W) axis was caused by: ‘the projection of the continental mantle at the buckling point by 5 (m).’ It resulted in, ‘having pulled the continental mantle towards Q1’s hypocenter.’ In the (–) X axis, it caused permanent horizontal land displacement as observed by seismographs. It must be recalled that the displacement isn’t by the sliding of the crust along the inter-layer surface between the crust and the mantle towards the epicenter, as plate-tectonic-ites explain, but the displacement of the continental mantle on which the crust layer rides intact. If the plate-tectonic-ites’ assertion is true, the consequences on the ground should be much more disastrous than it really happened. For instance, there must have been numerous faults. It also caused settlement in Japan’s Tohoku coastal areas as indicated in seismographs as permanent vertical displacement. It’s again not caused by the flow of the crust relative to the mantle but the Poison deformation of the continental lithosphere that was pulled after having lost thrust by buckling. The most fatal effect appeared in the (+) X axis. As the buckling was a dynamic motion, the oceanic mantle was subjected to pulling force after having lost compression. The oceanic uppermost mantle has no massive crust on it, hence, the dynamic tensile force could cut it at 300-km offshore (100-km beyond the Japan Trench) on the protracted Kinkazan Cape - Q1’s epicenter line. This is Q2’s epicenter. Q2 was followed by aftershocks in the ocean mantle’s continental side from its epicenter, one of which was MW 7.5, at 270 (km) offshore (see Fig. 9). All of them are beyond the Japan Trench. It must be emphasized that the aftershocks of Q1 and the aftershocks of Q2 are synchronized phenomena but occurred by the different main-shocks in the different plates, i.e. by Q1 & Q2 in the continental and oceanic plates of both the sides of the Japan Trench.
Q1 & Q2 caused maximum 1-m settlement in the continental and the oceanic mantle respectively. The settlement in the continental side is recorded in seismographs and can be confirmed by surveys. But the oceanic mantle’s settlement is not. However, it can be estimated by assuming the depth, width, length, elastic modulus, strain (before and after buckling) and poison ratio of the uppermost oceanic mantle that lost the compression force after buckling of the continental mantle and pulled by its own inertia. It caused a tsunami wave of 1-m high and.100-km long. The depth of the seawater there is 5000 m that’s enough to generate an unprecedentedly big tsunami. En passant, a 1-m GL down surge in the continental and oceanic mantles coincides to each other. It’s by chance. The –ve surge at both the sides isn’t necessarily the same.
The continental mantle’s movement due to the buckling propagated to (–) X & (-) Y directions in the crust, causing numerous consequences. Q3 off the North Ibaragi Coast is the greatest one.
CONTRADICTIONS IN QUAKE IDENTIFICATION BY THE THEORY
General
The Theory brings about contradictions in Quake identification. They are divided roughly into four categories, viz. the ones relating to the quake energy storage, ditto radiation, the type of rupture in quake and locating the Q2.
Comment: Speakers in this sub-sect. were quoted without calling by names.
In assumptions of quake energy storage
The Theory assumes that the quake energy is stored along a surface between continental lithosphere and subducting Pacific Ocean’s uppermost mantle at any point where fixation due to any irregularity appears arbitrarily. The Theory users consider, ‘The leading edge of the continental lithosphere has no ability to store the quake energy as the material there has no strength as has been broken by ceaseless thrust from the subducting plate. Hence, it’s a quake-free zone.’ Some call it a barrier. But actually a series of foreshocks and the unprecedentedly big Quake happened in this zone (Fig. 9). The Theory can’t give a solution to this contradiction.
The hypothesis’ assumption is contrary. The leading edge of the continental and oceanic lithospheres is too strong to be broken as it’s been strengthened by the forging effect of the tectonic internal thrust. It poses a role of an anchor block (abutment) that stores energy in the continental and oceanic lithosphere behind and before it. But the leading edge itself has never been and won’t be broken due to its high strength. The quake happened in this quake-free zone by an unprecedented cause, and radiated full energy stored in the continental crust and oceanic uppermost mantle. It’s elaborated in the next Sub-sect.
In sequence of energy radiation
A Theory user says, ‘The Quake unprecedentedly comprised plural main-shock that happened in a common fault plane with several-tens-second intervals. The second one had a greater magnitude than the first one, though, usually, sequent shocks are smaller than the first shock in magnitude.’ The person explains the phenomenon likening it to ripping paper, saying, ‘When we rip paper, it’s torn from the weakest point and the stronger sections follow it. The stronger point stores greater energy and is radiated when it’s torn.’ The likening is reasonable if the strong point exists in the material with continuity. Actually, the inter-layer fixation exists there with discontinuity as assumed by the Theory itself. If any irregularity exists in a homogeneous body (regardless the nature of irregularity if it’s strong or weak), it initiates a rupture at the point of the greatest discontinuity due to stress concentration. The writer experienced it through thousands of material tests. It can be confirmed by any popular means such as FEM, photo-elastic tests etc. Further, the strength of the specimen never rises once failure started.
The hypothesis can explain the phenomenon without such a contradiction. It assumes that Q1 & Q2 occurred simultaneously in a different plate. The latter radiated its energy at its hypocenter and performed work-done at Q1’s hypocenter. Because of energy loss, Q1’s magnitude must be less than Q2’s. Both were followed by their aftershocks respectively in the respective plates.
In assumptions of type of rupture of the Quake
The Theory assumes the mechanism of the Quake by the shear slide of the continental lithosphere relative to the subducting plate. The rise and the settlement of the oceanic and land side GL and tsunami are also explained based on this assumption. Suspicion appears first that if shear involves mantles as the Quake did, the land on the crust must suffer from great consequences as the Quake’s Q1 & Q2 did. Q3 that pertains to the usual pattern, the phenomenon was limited in the crust layer only; hence, it didn’t cause any unprecedented phenomena. Second, the tsunami wave form must have had a one-step-up-staircase profile (see Fig. 8). But, in fact, it had a two-step-up-and-down-threshold profile that corresponds to the buckling of a layer.
In locating Q2
There’s no Theory user who identifies Q2’s epicenter*1. It’s the consequence of Theory’s assumption of all-shocks-in-one-fault surface. It lets Q2 have the same epicenter as Q1*3. It practically made Q2 be homeless, and the tsunami (Ts2) & the aftershocks on the oceanic mantle be orphaned. Tsunami (Ts1) generated by Q1 arrived at the Sanriku Coast on time (10 min after Q1). ‘Where did Ts2 that arrived at the same coast 40 min after Q1 come from?*2’ Further, ‘Could aftershocks in an ocean mantle occur without a main-shock in the same plate?’ Prof. S. Okamoto must ask if he’d be alive now.
The hypothesis that assumes Q2’s epicenter at 300-km offshore in an oceanic mantle can fully reply the questions without contradictions. To prove this fact, no sophistication is needed but school children’s knowledge. That is, two waves that started the same origin with a certain time lag arrive at any destination with the same time lag, as they travel the same way with the same velocity. On the other hand, if the time lag is due to their different origins, they arrive at destinations with different time lags. In the case of the Quake, seismic stations’ formation is a linear N-S alignment, while Q1 - Q2 is an E-W. Hence, the travel time lag shows, ‘The farther the station is, the shorter the time lag is.’ Readers can confirm it by learning Fig. 4 and 5. Fig. 4 shows the fact analogously, while Fig. 5 does it with scales*4. It can be extremely proven by seismograph records beyond the Q2 epicenter. In these records, Q2 (identified as it’s greater) must be in the first place and Q1 (smaller) follows.
*1 As to Q1, Q2 & Q3, a Theory user says, ‘The arrival of two strong seismic wave groups is seen after about 50 seconds. The first massive rupture occurred at off Miyagi, and strong seismic wave was released all over Tohoku (the purple line in Fig. 1). After several tens of seconds, another massive rupture occurred and a strong seismic wave was released (light blue). (Due to) the distance from the rupture starting point, the arrival time of the seismic wave will be delayed. But for the second rupture (light blue), time lag caused by the distance is short. This indicates that this second rupture occurred at the offshore far away from the land.’ What he means is that Q2 & Q3 are near each other and far from the shore (the writer disagrees to it).
The statement adds, ‘Then immediately, the third rupture occurred at the offshore near land of the northern Ibaraki (red), and strong seismic waves were radiated toward Ibaraki Pref. and Tochigi Pref. The rupture property and the radiation characteristic of the third event have been different from the others.’ (It’s OK.)
*2 A Theory user says, ‘Ts2 was generated by an M 7.5 aftershock that occurred 270-km offshore and 40 min after Q1.’ Though the mechanism why this aftershock occurred in the oceanic mantle isn’t explained (its location is correct). This aftershock can’t be the origin of Ts2, because (i) 40 min after Q1, Ts2 had already been on land. (ii) M 7.5 has a power to generate only 3 ~ 4-m high tsunami. Refer to JCEA (1969), page 65, 66, Table 1-7-1 and Fig. 2-7-1.
*3 The reasons why the Theory users fall into a conceptual pit such that ‘Q1 & Q2 happened at the same point in the same fault plane with a time lag’ are: (i) Q2’s epicenter is on a protracted line of Q1’s epicenter and the nearest observation station, (ii) Q1 & Q2 happened simultaneously, hence, Q2’s P-waves aren’t visible in seismographs as overlapped by Q1’s wave form, and (iii) the time lag between Q1 & Q2 observed in seismographs is unable to differentiate if it is due to a different time of their occurrence or the distance between them. The time lag of the two events in seismographs didn’t represent a time of occurrence but a distance between the two. En passant, they could identify Q3’s hypocenter that’s not on the protracted seismograph - Q1 line.
*4 When Fig. 4 is scrutinized to learn the time lag between Q1 and Q2 ignore colored curves in it as they are drawn subjectively. When Fig. 5 is learnt, the comparison between (a) and (b) shall be made with the acceleration records rather than displacement ones. If displacement records are used, do analysis not with waves’ summits or end points but starting points. It’s because original waves’ characteristics disappear by integral processing.
In general
A report by researchers at Columbia Univ. in US, which says (extract) 'Among from several hundreds of shocks, applicable to beach-ball analyses are 88.' After analyses, it’s learnt that more than half of the worked-out beach balls are non-conforming (to the Theory… writer’s comment).’ It's right. Really, these beach balls can’t be explained by the Theory, but can be by the hypothesis. The non-conforming beach balls are the ones on the buckling line. Beach balls there must show irregular forms as the report found. It’s not, ‘The finding is non-conforming to the Theory,’ but ‘The Theory is non-conforming to the finding.’
WHAT DID TRIGGER THE ML 7.2 FORESHOCK?
An answer to this question is the cause of the cause of the Quake. The writer has been of the opinion that a certain human activity is triggering quakes. It was early 1970s when the writer pointed out a flooding method to help welling of old oil wells that had lost self welling power was suspected of the cause of 1964 Niigata Earthquake, Sohei Matsuno (1977).
Fig. 10 illustrates a conceptual geological structure of the crust under the Sea of Japan off the Niigata Coast. It shows three folds. The one in the extreme left is the Awa Is. A is a syncline where a hypocenter of 1964 Niigata Earthquake was. B is a pumping station of flooding operation on land. C is a sea oil station at an anticline where oil stays. Oil (1) is pushed up by pressure transmitted by a horizontal boring pipe (2); mined oil is transported by a submarine oil pipeline (3) from a sea station (4) to a land station (5). The writer supposed the water pressure (100 N/cm2) was the cause of the shear rupture at A. Sohei Matsuno (1974), ditto (1977).

Fig. 10 Geological model of off Northeast Coast of Japan (source: 1977 Niigata Daily)
There’s no oil resource in off Japan Pacific Coast. A possible trigger could be a nuke test as some suspect (refer to a different paper in the same www.iba.ac.id). There’re good reasons of the suspicion. A method is to place a nuke warhead at a leading top of the horizontal pipe (2). The method was explained in the Daily in 1977 and technical journals, [3], [4] and [5] as an ultimate weapon named Intra Crust Boring Nuke (ICBN). The fact can be verified by detecting a suspicious boring site at the Sanriku Coast.
CONCLUSIONS AND RECOMMENDATIONS
This paper shall forward a packet of questions before the Theory users. Appropriate answers without fantastic assumptions and contradictions are to be the conclusions of this paper.
(1) Why the foreshocks and two main-shocks unusually happened in a usually-no-quake zone?
(2) Why the Quake unprecedentedly comprises plural main-shock?
(3) Despite three main-shocks, why only two epicenters are shown?
Is it because the biggest two main-shocks occurred too near to differentiate? If yes, go ahead.
(4) Why the tsunami caused by the 1st and 2nd main-shocks arrived at the Sanriku Coast with several tens of minute time lag, despite the time lag between the 1st and 2nd main-shocks themselves is several tens of seconds?
(5) Against the popular strength of material theory, why did the lithosphere increased strength on a timeline of a rupture?
(6) Did the aftershocks on a different plate happen without a main-shock in the same plate?
(7) Why the tsunami wave form doesn’t conform to the seabed deformation profile of a reverse fault that the Theory users assume?
Its recommendations are as follows:
(1) If the Theory answers the above questions keeping the basic concept of the Theory, it’s wonderful per se. The writer shall learn it. If not, consider revisions. ……… Every theory of eminence / massiveness is doomed to collapse unless revised. The collapse happens by an object to which the Theory no longer applicable. It’s too massive to let it to conform to the reality; hence, it’s leting the reality conform to the theory. It’s the omen of the collapse.
(2) The writer recommends the revisions in a manner when it’s applied to respective quakes. The suggested revisions involve: (i) the status of the contact surface between the overriding continental and subducting oceanic lithospheres, especially at the leading edge of the continental lithosphere, (ii) the mechanism of a quake other than shear, (iii) Establishment of more realistic/practical method to identify magnitude of a quake, and (iv) induction of applied mechanics and a physical model test system with similitude to geological objects in analyses of properties of massive geological structures and components.
(3) Though this paper has yet to prove the hypothesis to a theory, it explained the Quake with no contradiction that’s a necessary condition for any hypothesis to be a theory. The writer asks next generation researchers to take over this theme for a theory.
REFERENCES
Japan Association of Civil Engineering (1969), ‘Guides for Coastal Protection Facilities,’ Japan Association of Civil Engineering (JACE) 1969
Nuclear Safety Inquiry Commission (1977), ‘Approval to the construction of Kashiwazaki NPP requested by Tokyo Electric Power Co. (TEPCO), as it’s safe at a seismic time,’ The Mainichi, Aug. 13 1977 (Japan)
Shunzo Okamoto (1973), ‘Introduction to Earthquake Engineering (English),’ University of Tokyo Press 1973 (Japan)
Sohei Matsuno (1974), ‘Remarks on the danger of Kashiwazaki NPP on a Seismic Fault,’ The Niigata Daily, Aug. 08 1974 (Japan)
Sohei Matsuno (1977), ‘The possibility of a Crust Weapon,’ The Niigata Daily, Aug. 09 & 16 1977 (Japan)
Tomoaki Ozaki (2011), ‘Outline of the 2011 off the Pacific coast of Tohoku earthquake
(Mw9.0) --- Tsunami warnings/advisories and observations ---,‘
Japan Meteorological Agency, Otemachi 1-3-4, Chiyoda-ku, Tokyo, 100-8122, Japan
PS
This paper was accepted by an academic journal 10 months ago. But the journal paused for its operation and there’s no prospect when it’ll resume. Hence, the paper is now put in www.iba.ac.id. There might be something outdated because of the time lag.
No comments:
Post a Comment